
Why a Gorgeous Backtest Can Lie — And How CoinRoc Catches It
CoinRoc's grading system now corrects for two things every backtest hides: whether the strategy was actually running, and whether the market can actually fill the orders. Here's what changed and what it means for the grades you see today.
Here is a scenario worth thinking through.
You are looking at two assets on a grid trading platform. Asset A has a backtest return of 34%. Asset B backtests at 18%. Everything else being equal, you pick Asset A — of course you do. The number is right there.
Except.
What if Asset A’s beautiful backtest assumed fills at every grid level at the exact simulated price, on an order book that actually trades $800,000 per day globally? An order book where, in practice, your grid would compete with every other market participant for a trickle of liquidity — and where “fills at the grid price” is an assumption the market may not be able to support at any meaningful scale?
What if Asset B’s 18% came from a regime-aware strategy that correctly paused new buys during a 40% market drawdown — and the 18% is what the grid mechanism earned when it was actually running?
The backtest headline told you to pick A. The honest grade disagrees.
This is the problem CoinRoc’s execution-aware grading is designed to solve.
The Grid Is Not a Bet on Price
The first thing to understand about grid trading is what it does and does not do.
A grid strategy places a ladder of buy and sell orders across a price range. It profits from the asset oscillating up and down — each oscillation harvests a small spread. It is explicitly not a directional bet. You are not betting that SOL goes up. You are betting that SOL moves around within a range.
CoinRoc’s grid strategy uses an adaptive system (the Adaptive Grid RXI) to decide when those conditions exist. When the market is strongly trending in one direction — the environment where grid strategies historically struggle — the RXI pauses new grid buy orders; existing inventory continues to be managed by the strategy, but no new capital is deployed into the grid until conditions improve. When the market returns to a regime where ranging behavior is more likely, the grid re-engages.
This is by design. The grid strategy is not supposed to be active all the time.
The Problem with Measuring the Wrong Thing
Until recently, CoinRoc’s Discovery page filtered assets using a blended return metric — the total portfolio return across the entire evaluation window, including the periods when the RXI had correctly paused new buys.
Here is why that is a problem.
Take SOL/USDT. During the Year 2 evaluation period used in CoinRoc’s backtest analysis, the SOL market fell sharply. A retrospective classifier later found that roughly 23% of the period would have qualified as a pause-favorable regime under the RXI’s design rules. (Note: the specific backtest measured here used a fixed grid-engagement setting for all symbols, so the strategy did not literally pause during that 23% — see the linked methodology paper for the distinction.) But the blended return metric counted the full portfolio drawdown across the entire period, including the portion that this retrospective read would have classified as pause-favorable.
SOL’s blended return for Year 2: -45.5%. The Discovery filter hid it. SOL’s active-period return — grid performance only during the windows the retrospective classifier reads as regime-active: -9.8%.
SOL was being graded on something the blended metric couldn’t distinguish: a market-wide drawdown from the grid’s own performance. A retrospective classifier — not a live decision this backtest’s simulation actually made — found that a meaningful share of that drawdown would have qualified as a pause-favorable regime under the RXI’s design rules. Penalizing the grid strategy for a market move a retrospective read would have excluded is like grading a quarterback on plays the coach would have pulled him from, even though, in this specific test, the coach never got the call.
The same pattern showed up across 37 assets that the blended filter was hiding. When Yodacom Research ran the active-period analysis:
- 27 of those 37 assets (73%) would pass the filter under the correct metric
- 6 of the 27 had positive active-period returns — the grid was profitable when it ran
Simulated backtest results from a Year 2 blind forward test. Past simulated performance does not predict future results. All figures reflect the retail-binance-us fee tier, Year 2 blind forward test window, under a specific grid strategy configuration. Results will differ at other fee tiers, capital sizes, or grid configurations.
A few examples from the analysis:
| Symbol | Blended Return | Active-Period Return |
|---|---|---|
| LINK/USDT | -39.6% | +2.1% |
| BCH/USDT | -27.9% | +3.9% |
| DOGE/USDT | -30.1% | -5.1% |
| HBAR/USDT | -35.5% | +0.8% |
These are not small differences. They are the difference between “filtered out as a poor grid candidate” and “grid mechanism performing reasonably in its elected active windows.”
The BTC sanity check: BTC’s active-period return equals its blended return (-40.2% both) because the retrospective regime classifier used to compute the active-period window found no candles in the period it would exclude — not because the simulation itself paused new buys. (The specific backtests referenced in this article used a fixed grid-engagement setting across all symbols; see the linked methodology paper for the distinction between that test configuration and the RXI’s designed pause-and-resume behavior.) The corrected methodology does not rescue BTC. BTC is genuinely failing the grid mechanism’s own test, and it stays hidden from Discovery — with a clear label explaining why. Transparency, not suppression.
The Other Way a Backtest Lies: Fills That Do Not Exist
The active-period fix addresses the timing problem. The liquidity fix addresses the execution problem.
Grid trading places many resting limit orders across a price range. The backtest assumes every one of those orders fills at the grid price, with the market absorbing each fill without moving the price against you. For Bitcoin or Ethereum — assets with tens of billions in daily global trading volume — that assumption is defensible. For an asset with $800,000 in daily global volume, it is not.
Before this update, CoinRoc’s liquidity scoring component had null values for 91 of 93 graded assets. The grade was being calculated almost entirely from the backtest return and statistical ratios — no signal about whether the order book could actually execute what the backtest described.
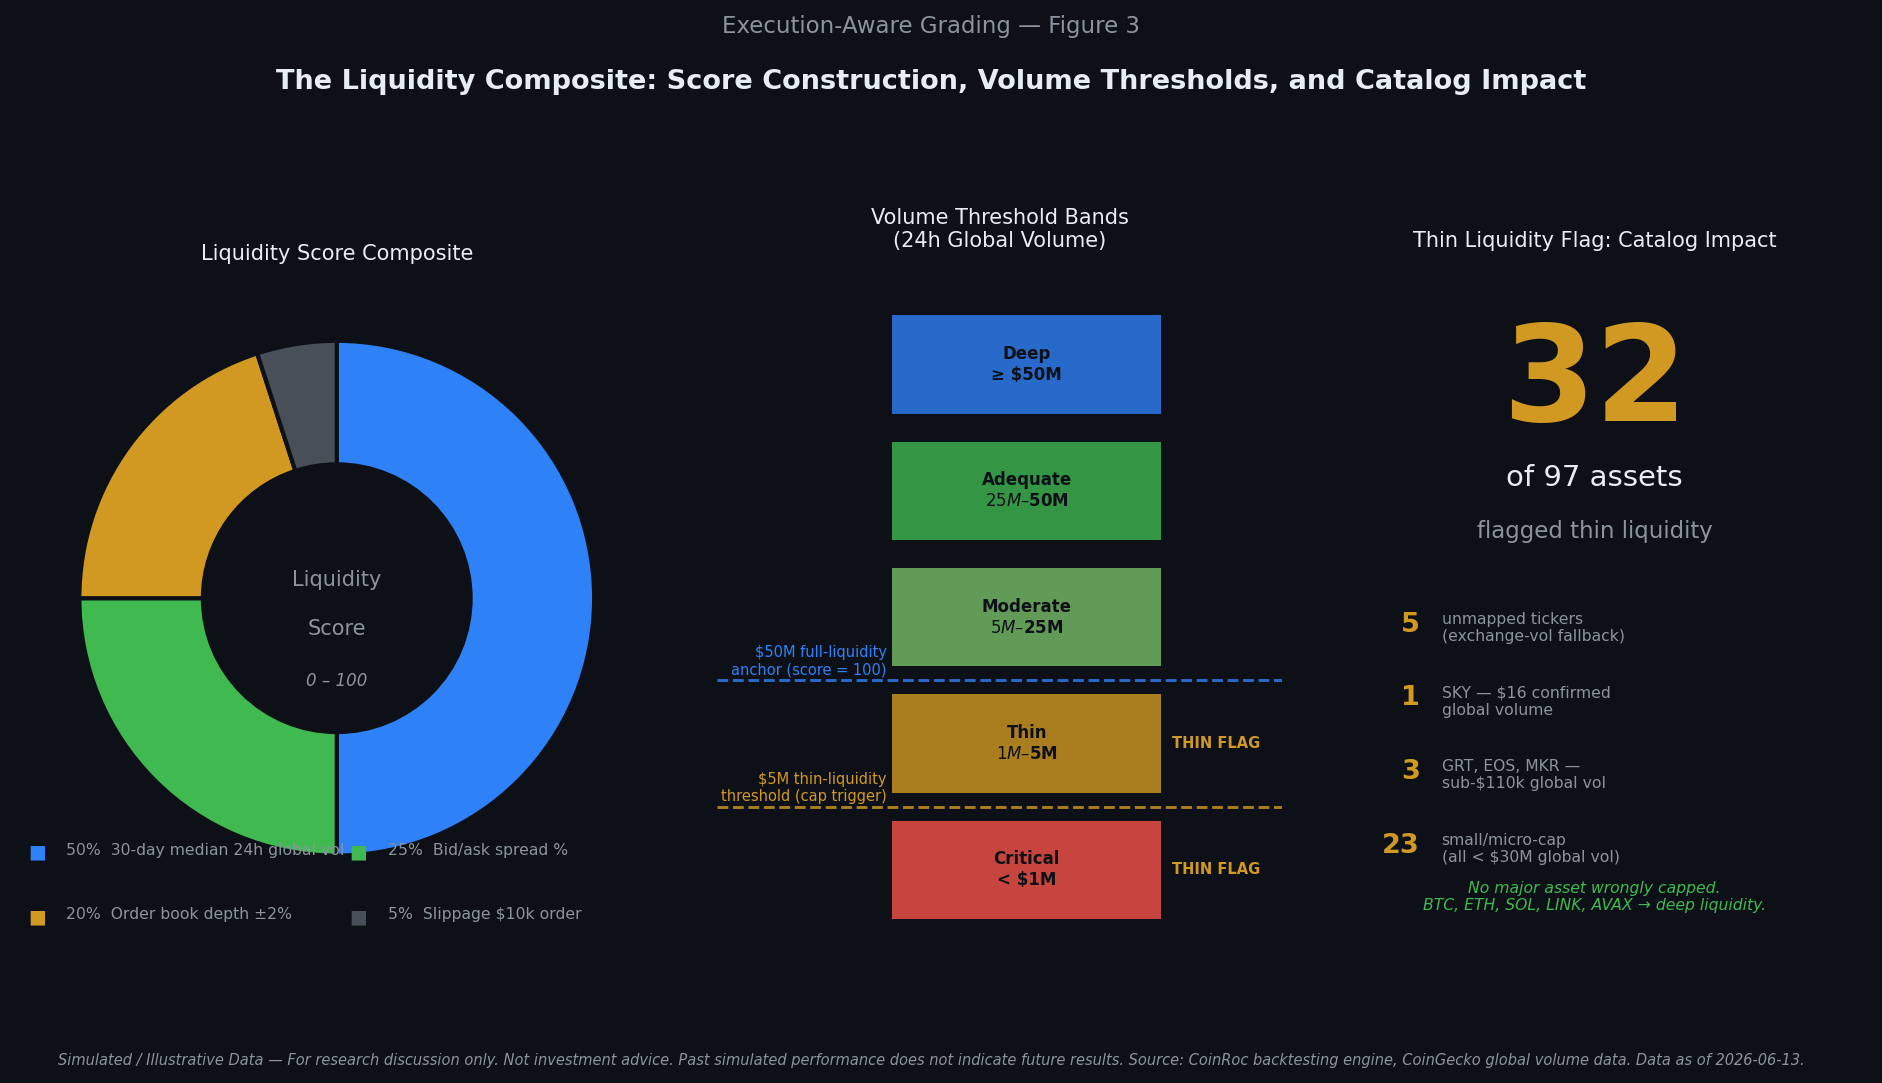
The corrected system scores each asset’s liquidity using four signals: global 24-hour trading volume (50% weight), bid/ask spread (25%), order book depth across the active grid range (20%), and estimated slippage for a representative order (5%). Assets scoring below a threshold — roughly equivalent to under $5 million in daily global volume — are flagged as thin liquidity.
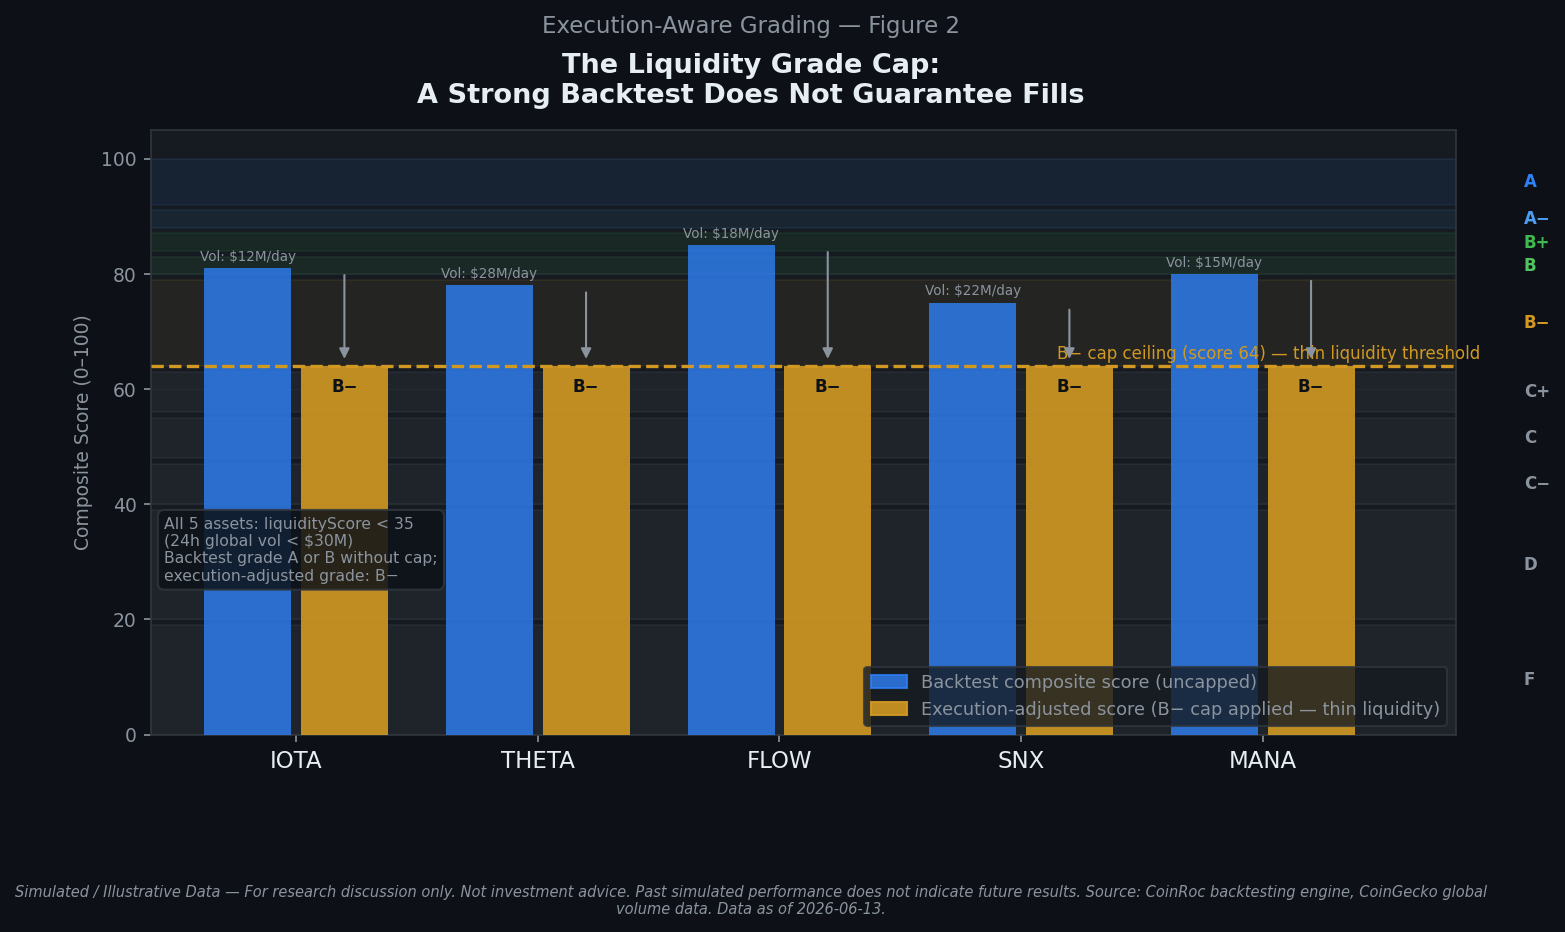
Here is the counterintuitive part: if a thin-liquidity asset’s backtest would otherwise earn a grade of A or B, the grade is capped at B-.
Not because the backtest is wrong on its own terms. Because a grade of A implies a level of execution reliability the order book cannot provide. The simulated return under ideal fill conditions may appear favorable. What the grade is supposed to tell you is how confident you can be that live trading will approximate that simulation. On a thin order book, the honest answer is: not very confident.
The cap is not a ban. Thin-liquidity assets remain in Discovery. They show a visible amber badge:
“Thin liquidity — fills may slip; treat backtest return as an optimistic scenario reference.”
What the badge is telling you: this asset’s grid may be worth exploring at a small position size, with adjusted expectations. What it is not telling you: avoid it entirely. Transparency over suppression — the information is yours to use.
In the full 97-asset catalog, 32 assets currently carry the thin-liquidity flag. The major assets — BTC, ETH, SOL, LINK, AVAX — are not among them. The flagged assets are small-cap and micro-cap positions where global trading volume is too thin for reliable grid execution at meaningful scale.
What You Actually See Now
When you open CoinRoc’s Discovery page today, the grades reflect two things the old system did not account for:
When the grid was running. An asset’s grade is now based on how the grid mechanism performed during active trading windows — not on total portfolio movement during periods the RXI correctly sat out.
Whether fills were available. An asset’s grade is now capped if the order book cannot reliably support the execution the backtest assumed. If that cap was applied, you see it. You see why.
Assets hidden from Discovery are no longer just “didn’t pass the threshold.” They show a reason: “Grid underperforms at your fee tier even in favorable market conditions.” You can see them. You can understand the finding. You can decide whether you want to dig deeper.
This is the honesty-over-hype version of a grade. Not “here is the best-case simulation number.” More precisely: here is what the grid mechanism appears to do when it runs, constrained to what the market can actually execute.
The Honest Grade
Backtests are useful. They are not reality. The gap between a backtest and a live trade has two major dimensions: timing (was the strategy actually running?) and execution (could the market fill the orders?).
CoinRoc’s grades now explicitly account for both. That means some assets with impressive backtest numbers earn a B- with a disclosure badge rather than an A. That is the system working correctly.
An honest grade that reflects actual execution risk is more useful than a flattering grade that implies execution conditions the market may not be able to support. That is the only kind of grade worth building a trading decision around.
All performance figures in this article are simulated backtest results from a Year 2 blind forward test window. Simulated performance does not predict future results. CoinRoc is a strategy analysis and simulation tool, not an investment advisor. No content in this article constitutes investment advice or a recommendation to buy, sell, or hold any cryptocurrency.
Explore Discovery — coinroc.com/discovery
LANDO-EXEC-GRADING-CONSUMER-01 — Lando, Senior Content Writer & Strategist, Yodacom AI Team. Matlock compliance review completed 2026-06-13 (CLEARED-WITH-EDITS, Gate 1). Source: han-exec-grading-research-report-2026-06-13.md, Sections 1–6. For the advisor-facing methodology summary, see Yodacom Research: Why a Quality Grade Must Reflect What You Can Actually Trade.