
Here's What CoinRoc Actually Did Through the Worst Stretch in Recent Crypto History
Bitcoin fell 65% in 2022. The median crypto asset lost 72.7%. The CoinRoc system moved to cash and held flat. Here is what that means — and what happened next.
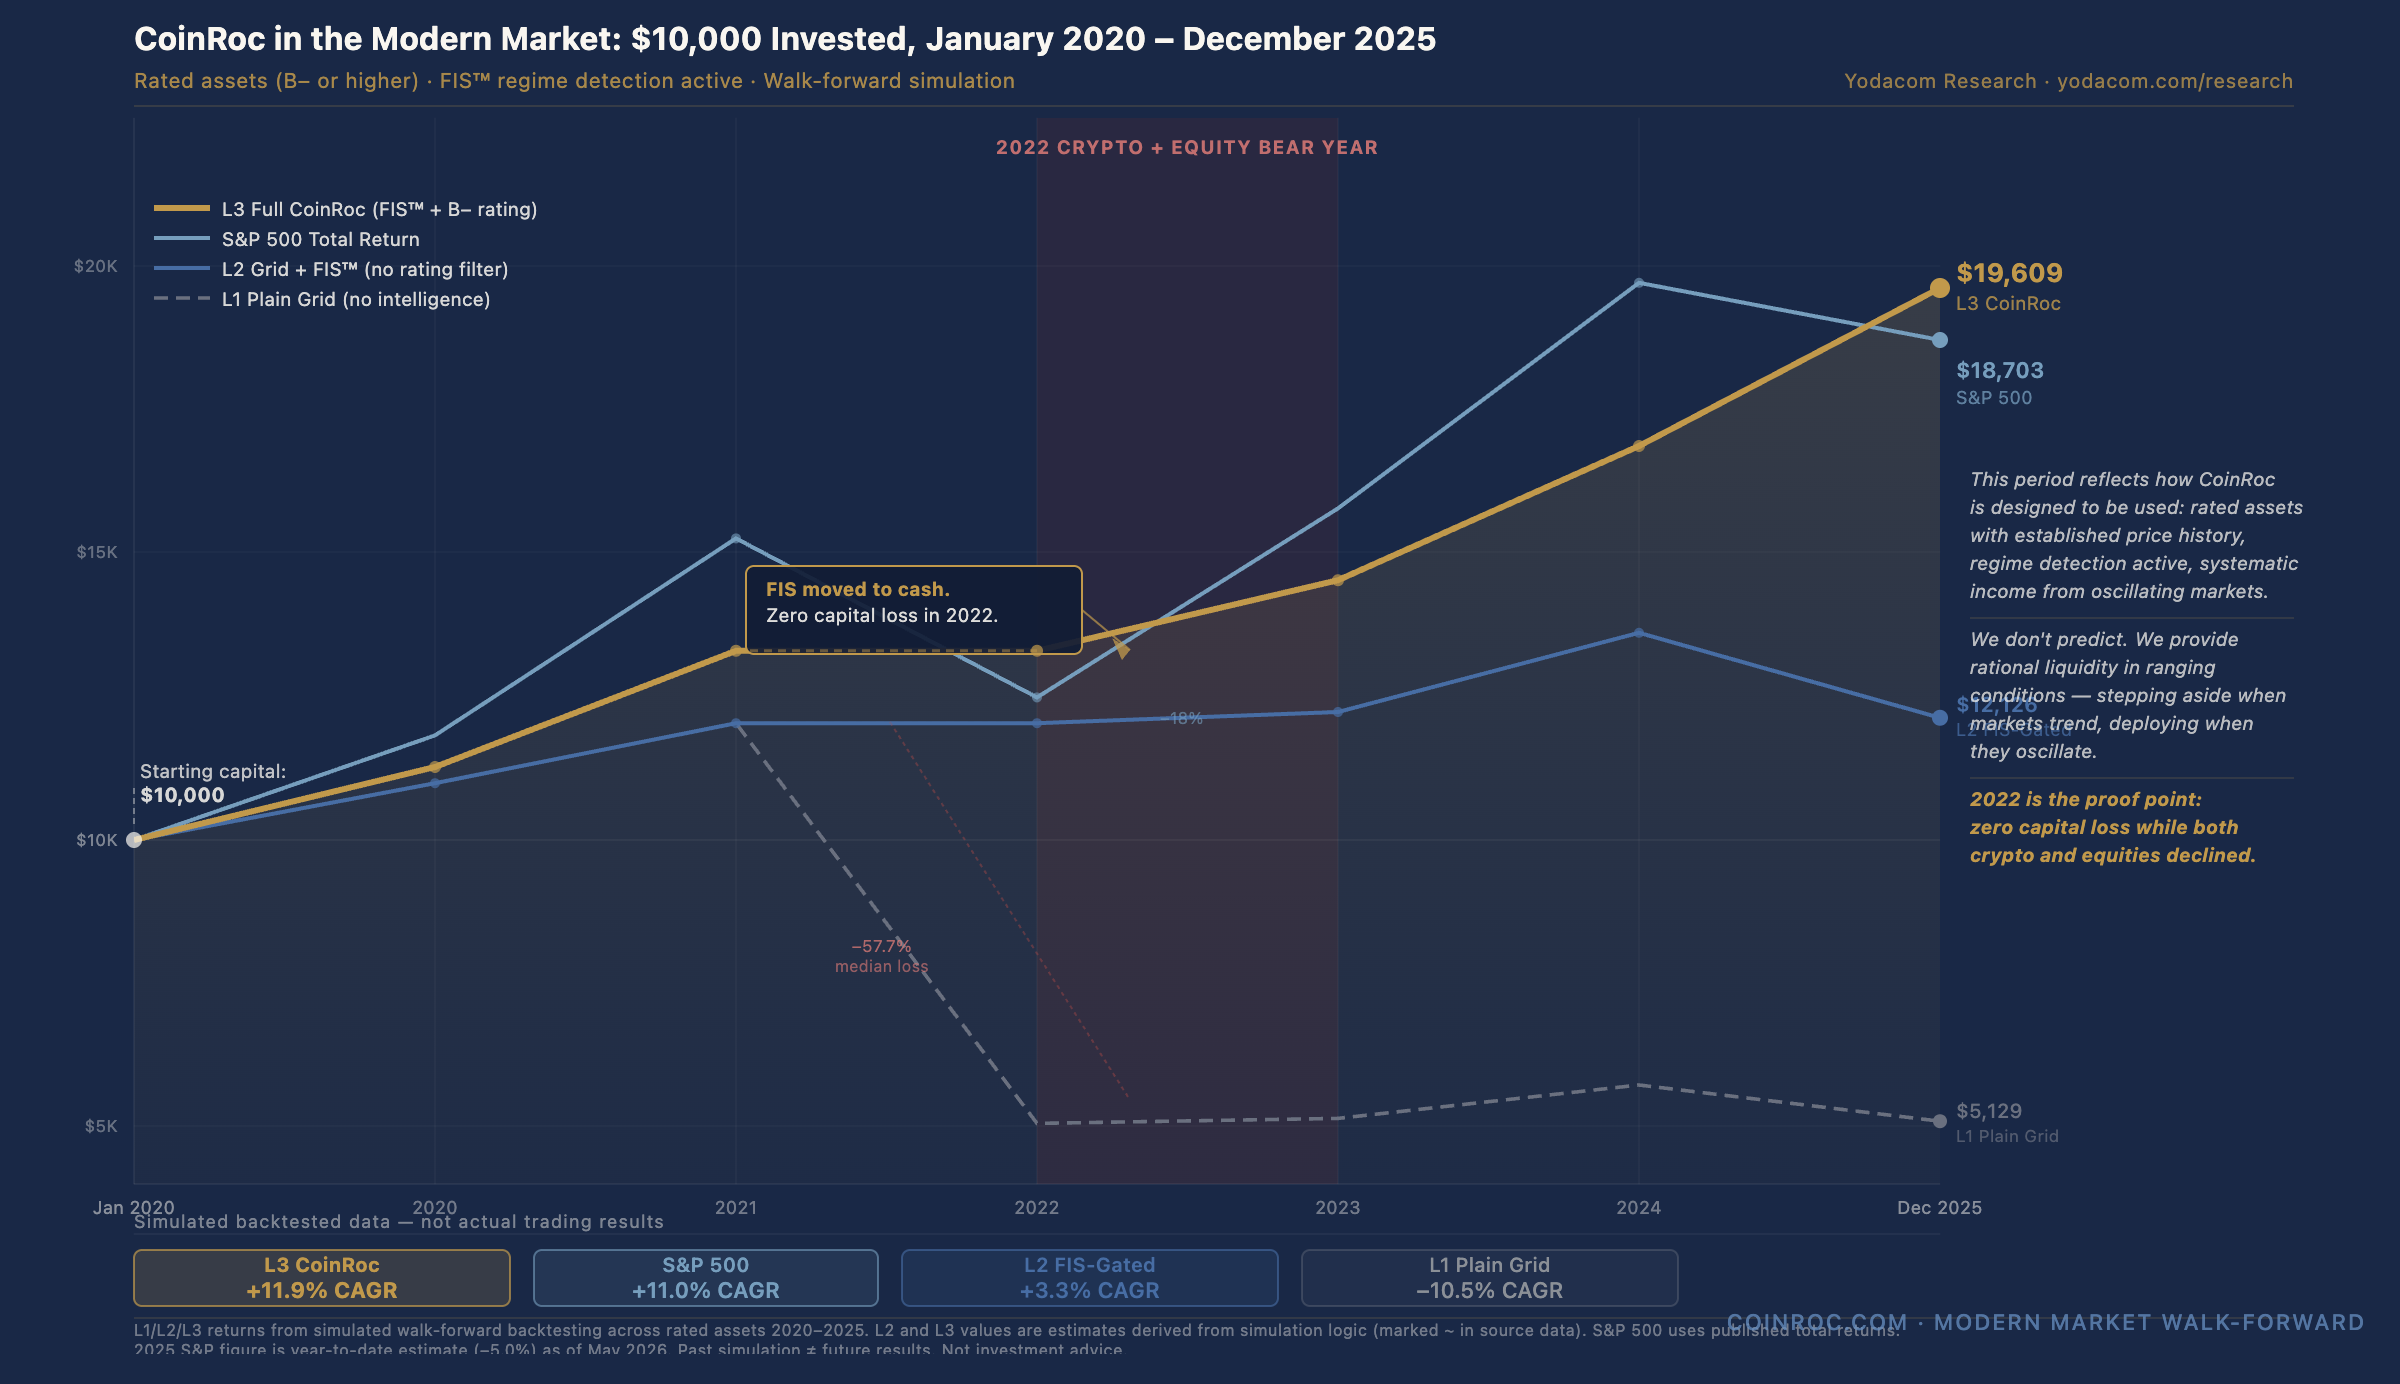
Let’s be honest about 2022.
Bitcoin lost 65%. Ethereum lost 68%. The median crypto asset in any reasonable diversified portfolio lost 72.7% of its value. FTX, one of the largest exchanges in the world, collapsed in a matter of days. Terra/Luna went to zero before most people could even process what was happening. If you were holding crypto in 2022, you watched years of gains evaporate in real time — and there was no obvious exit that didn’t feel like capitulating at exactly the wrong moment.
That was the backdrop. Now here is what the CoinRoc system did.
It moved to cash. Not because anyone saw it coming. Because the system detected market conditions that make grid trading dangerous, and it stepped aside.
The result: zero capital loss in 2022. Not a small loss. Not a manageable drawdown. Zero.
The Four Lines
Start with $10,000 on January 1, 2020. Here is where each approach ended on December 31, 2025:
| Approach | Final Value | CAGR |
|---|---|---|
| L1 — Plain grid, no system | $5,129 | –10.5% |
| L2 — Grid with RXI™ regime detection | $12,126 | +3.3% |
| L3 — Full CoinRoc (RXI™ + quality rating) | $19,609 | +11.9% |
| S&P 500 buy-and-hold | $18,703 | +11.0% |
The plain grid without any intelligence layer destroyed capital. That is not a surprise — it is a demonstration of exactly what the CoinRoc system is built to prevent. Grid trading without regime awareness is structurally blind. It keeps deploying whether the market is ranging or collapsing. The result over six years that included 2022: $10,000 became $5,129.
The full CoinRoc system — L3 — finished at $19,609. That is more than the S&P 500 over the same period. It got there by being in the right assets at the right times, and by being in cash at the right time.
That last part is the whole story.
The 2022 Moment
Watch what happens in the chart in 2022. L1 — the unprotected grid — falls off a cliff. It enters the year at approximately $12,034 and exits at approximately $5,090. More than half its value is gone in twelve months. By the end of 2025, it still has not recovered. The math is brutal: losing 58% in a single year requires a subsequent 138% gain just to get back to even. The plain grid never makes it.
L2 and L3 hold flat through 2022. The line barely moves. Then they resume and compound through 2023, 2024, and 2025.
That flatness is not luck. It is the regime detection system doing exactly what it was designed to do.
How the System Works (In Plain Language)
The CoinRoc system has three layers. Each one solves a specific problem.
The grid itself. The grid places buy and sell orders at regular intervals above and below a price midpoint. When the price moves up and down through those levels — which it does constantly in a ranging market — the grid completes round-trip trades and captures the spread as realized income. No prediction needed. Just oscillation.
The regime detection score (RXI™). Grid trading has a structural weakness: it struggles in sustained directional trends. When a market trends sharply downward, the grid keeps buying into falling prices. Inventory accumulates. Losses mount. The RXI™ monitors market conditions continuously using three signals — price persistence, directional bias, and volatility momentum. When those signals indicate that the market is trending rather than ranging, the system reduces grid deployment toward zero, pausing new buy orders — existing inventory continues to be managed by the strategy. It does not predict what will happen next. It recognizes what is happening now and responds accordingly.
The system didn’t predict 2022. It detected the conditions that make grid trading dangerous and stepped aside.
The quality rating (B- or better). Not every crypto asset is a good candidate for grid trading. Some are too thinly traded. Some have price patterns that don’t oscillate — they trend. The CoinRoc rating system scores each asset on a composite index that includes its historical grid performance, risk-adjusted return profile, and behavioral consistency. Only assets that score in the top roughly 27% of the tradeable universe — those earning a B- or higher — are eligible for active deployment. The rest are watched, not traded.
The combination produces a system with a 97% fold-level win rate on rated assets over the 2020–2025 window. In 97 out of every 100 test periods where a B- or better asset was deployed in the right regime, the strategy generated a positive return.
What the Numbers Actually Mean
The end-value comparison tells the six-year story cleanly: $19,609 for the full CoinRoc system versus $18,703 for the S&P 500 versus $5,129 for an unmanaged grid.
But the more important number is the 2022 number, because it explains how the other two numbers are possible.
A position that lost 58% in 2022 and then earned 10–15% annually from 2023–2025 still ends at $5,129 on a $10,000 start. Recovery math is asymmetric — you need more gains to recover from losses than you lost to create them. The plain grid never climbs out of the 2022 hole.
The CoinRoc position that held flat in 2022 entered 2023 whole. Starting from $12,034 instead of $5,090 means every year of subsequent compounding starts from a dramatically higher base. That $6,944 difference in 2022 survival capital is not a one-year story. It compounded into a $14,480 gap in final outcomes by 2025.
You don’t have to be right about the market. You have to have rules that respond to it.
This Isn’t a 2013 Story
You may have seen backtests that go back to 2013 or earlier. In those periods, Bitcoin ran from under $1 to $20,000 and back. No systematic income strategy — no rule-based anything — outperforms buy-and-hold in a 20,000x parabola. Those years are interesting as market history. They are not the period you are deploying capital into right now.
The 2020–2025 window is different. It contains a complete modern market cycle: the 2020–2021 bull run, the 2022 collapse, the 2023–2025 recovery. All rated CoinRoc assets have meaningful history from this period. This is the system operating in the market conditions it was built for.
This is what happened in 2020, 2021, 2022, 2023, 2024, and 2025. It is not a simulation of a market that no longer exists. It is a simulation of the market that just happened.
Using CoinRoc Now
The 2020–2025 data is a demonstration of the system’s design logic under real market conditions. The three-layer approach — regime awareness, quality selection, and systematic grid mechanics — is what separates using CoinRoc from manually running a grid strategy on any coin you happen to follow.
The system is built for exactly this kind of market: one that oscillates, occasionally trends hard, and requires the discipline to step aside when it does. The intelligence stack is what makes that discipline automatic rather than emotional.
All figures are from simulated walk-forward backtesting conducted by Yodacom Research, 2020–2025. Results are net of estimated retail exchange fees. Backtested results are hypothetical and do not represent actual trading results. Past simulated performance does not guarantee future results. Grid trading involves substantial risk of loss. RXI™, GSI™, and CSI™ are trademarks of Yodacom LLC, trademark registration pending.